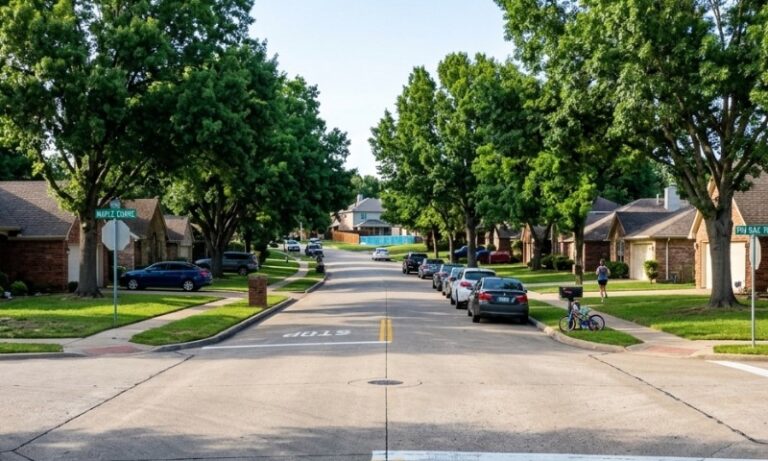

Houston sits in a moment where buyer enthusiasm keeps rising while available homes struggle to keep pace.
Market analysts see steady construction and a record number of active listings, yet many shoppers still find slim choices in the neighborhoods they want most.
Pressure builds inside a region known for resilience, and every month reveals new signals about what rising demand means for affordability, competitive offers, and the path ahead for a place growing faster than many expected.
Join us as we explore how supply limits shape Houston housing and what buyer demand reveals about the months ahead.
Current Supply Levels in Houston
Houston entered late 2025 with supply expanding while buyer interest stayed firm. Months of inventory reached 5.2 months in October 2025, up from about 4.4 months one year earlier.
Active single-family listings grew to about 38,300, which marked roughly a 25 percent year-over-year increase.
Average time on market rose from 52 days to 59 days, which softened the pace without removing pressure in sought-after zones.
Key Indicators
- 5.2 months inventory in October
- 38,300 active single family listings
- 59 days average time on market
- Supply now aligned with the balanced four to six-month range
Meaning for Buyers and Sellers
Supply growth eases the frantic conditions that defined earlier cycles.
Sellers face a more measured pace that demands cleaner pricing and stronger presentation.
Buyers gain added space to evaluate options, although competition remains firm when a home enters the market with strong condition and a realistic price.
Buyer Activity Trends in the Metro Area
Buyer traffic held steady even while more inventory reached the market.
Single-family closings in October reached about 7,420, which reflected a gain of roughly 3 percent compared with last year.
September closings approached 7,400, about 5 percent higher than the same month one year earlier.
Pending contracts surged by about 13 percent during October, which signaled forward momentum entering the next period.
On the other hand, this doesn’t mean that you can sell a house in any condition so easily. For instance, just putting it on a list and thinking it will sell in a day or two. Even if that happens, some things will lower your price if you don’t pay attention.
For example, if your home needs some improvements, especially technical ones, you should deal with that before the sale, as you will get a higher price, even with the costs of upgrades and maintenance involved.
Small details can also make a big difference. Like clean gutters, fixed roof, and similar details. You can always hire a power washing Houston service to clear the food, facade, gutters, driveway, and other parts of the front yard.
Inventory Distribution by Price Range

Homes listed at different price tiers are behaving in distinctly different ways, providing useful signals for where supply pressure is most acute.
For example, in September 2025, homes priced at or above $1 million saw sales rise by about 27 % year-over-year, while inventory in lower price bands climbed and price cuts became more common.
Sources show that active listings increased in many segments by more than 30 % in a year. The disparity means that what a “balanced” market means depends heavily on price point.
Price-tier Snapshot
- $250,000-$499,999: slight annual drop in sales (-1.3 % for September)
- $500,000-$999,999: modest sales growth (+3.7 % for same period)
- $1 million +: strong growth (+27 %)
- Inventory increases in many tiers range from +25 % to +40 %
Buyers shopping below the $500,000 mark may now face less competition and more negotiable conditions than earlier in the cycle, while sellers in the luxury market must lean on condition and marketing to capture buyer interest.
Investors and buyers at higher tiers need to differentiate their offering in a market where supply is expanding fastest.
Inventory Distribution by Region Within the Metro
Market conditions vary widely by geography within the metro area, making localisation essential.
While the broader region shows growing supply, highly desired suburbs and inner-ring neighborhoods still see tighter inventory and faster turnover.
For instance, some master-planned communities continue to average fewer days on market than the metro average, and price pressure remains higher.

Regional indicators
- Suburbs with premium school systems continue to see multiple offers and shorter marketing times.
- Outer areas and older suburbs show many more listings and longer days on market as buyers become more selective.
- Record inventory levels: one report cited over 39,000 active listings in August 2025, indicating that the “whole market” narrative around supply still hides big local variation.
Buyers should zero in on neighbourhood-specific inventory trends rather than rely solely on metro-wide averages.
Sellers must be aware that where they list could matter even more than when they list, and lagging neighbourhoods may need more aggressive pricing or faster marketing.
Recent Pricing Movement in the Market
Even while inventory expands and marketing times lengthen, pricing behaviour shows a cautious but visible adjustment.
In September 2025 median price for single-family homes fell to about $327,000, representing a decline of 2.1 % year-over-year.
At the same time, the average price rose by about 2.0 % to approximately $421,655, driven largely by luxury segment strength.
Pricing metrics
- Median price: ~$327,000 (down 2.1 %)
- Average price: ~$421,655 (up ~2.0 %)
- List-to-sale ratio: about 93 %, the lowest level recorded since HAR began tracking
Construction Output and New Housing Additions
Houston builders kept activity at a strong pace, yet the flow of new homes still fell short of buyer needs in the most competitive areas.
Permit levels in recent years reached some of the highest totals in the nation, with more than 230,000 residential permits issued from 2020 through 2023.
Supply expansion helped lift inventory above five months during 2025, but new construction often landed in outer zones where demand was less concentrated.
Mortgage Rate Influence on Buyer Behavior
Borrowing costs continued to shape who could remain active and how quickly decisions were made.
Mortgage rates during 2025 hovered in the mid to upper six percent range for much of the year, which kept some households on the sidelines.
Buyers still in the market tended to be well qualified and prepared to act quickly when listings matched budget and expectations.
Short-Term Market Indicators from HAR Data
Recent updates from the regional market show a mix of stabilizing supply, steady buyer activity, and modest pricing adjustments.
Inventory holds near the balanced range, pending contracts show clear movement, and marketing times continue to stretch slightly.
Market watchers expect the next quarter to reflect a similar blend of moderate buyer pressure and expanding inventory.
Indicators to Monitor
- Pending contract volume trending upward
- Marketing times stabilizing in the high fifties
- Balanced supply range sustained for multiple months
- Price movement staying within a narrow band
View this post on Instagram
Bottom Line
Home supply limits in Houston remain real even as inventory rises, and buyer demand continues to apply steady pressure.
The market settles into a more balanced zone, yet popular areas still move fast and pricing reflects that tension.
The months ahead will show how well rising supply can meet a level of demand that has not eased.
Read more: How Texas plans advisory body to cut energy waste and boost grid reliability!